MacKenzie, I. S., Sellen, A., & Buxton, W. (1991). A comparison
of input devices in elemental pointing and dragging tasks. Proceedings
of the CHI `91 Conference on Human Factors in Computing Systems, pp.
161-166. New York: ACM.
A Comparison of Input Devices in Elemental Pointing and Dragging Tasks
I. Scott MacKenzie1, Abigail Sellen2, and William
Buxton2
1Ontario Institute for Studies in Education
University of Toronto
Toronto, Ontario, Canada M4S 1V6
1Seneca College of Applied Arts and Technology
Toronto, Ontario, Canada M2J 2X5
2Dynamic Graphics Project, Computer Systems Research Institute
University of Toronto
Toronto, Ontario Canada M5S 1A4
ABSTRACT
An experiment is described comparing three devices (a mouse, a trackball,
and a stylus with tablet) in the performance of pointing and dragging tasks.
During pointing, movement times were shorter and error rates were lower
than during dragging. It is shown that Fitts' law can model both tasks,
and that within devices the index of performance is higher when pointing
than when dragging. Device differences also appeared. The stylus displayed
a higher rate of information processing than the mouse during pointing
but not during dragging. The trackball ranked third for both tasks.
KEYWORDS:
Input devices, input tasks, performance modeling.
INTRODUCTION
The actions of pointing and dragging are fundamental, low-level
operations in direct manipulation interfaces. While pointing tasks have
been studied extensively (see, for example, the surveys by Milner, 1988
and Greenstein & Arnaut, 1988), the same is not true for dragging.
The present study addresses this imbalance. It is driven by a belief that
the human factors of the full range of direct manipulation tasks must be
better understood. With such understanding emerges the ability to develop
better predictive and analytic models, for example by extending the Keystroke-Level
Model of Card, Moran, and Newell (1980) to handle this mode of interaction.
This paper has two main contributions. First, it shows that dragging
is a variation of pointing, and consequently, that Fitts' law can be applied
to it. Second, it establishes that the performance of input devices in
each
of these two tasks should be considered in characterizing the human-factors
of devices.
We present an experiment comparing three devices (a mouse, a tablet,
and a trackball) in both a pointing and a dragging task. Each is modelled
after Fitts' reciprocal tapping task (Fitts, 1954).
Fitts' Law: An Overview
Pointing (target acquisition) tasks have been studied extensively. Much
of this work is based on a robust model of human movement known as Fitts'
law (Fitts, 1954). The law predicts that the time to acquire a target
is logarithmically related to the distance over the target size. More formally,
the time (MT) to move to a target of width W which lies at
distance (or amplitude) A is
MT = a + b log2(2A / W) (1)
where a and b are empirical constants determined through
linear regression. A variation proposed by Welford (1968) is also widely
used:
MT = a + b log2(A / W + 0.5). (2)
The log term is called the index of difficulty (ID) and carries
the units "bits" (because the base is "2"). The reciprocal of b
is the index of performance (IP) in bits/s. This is purportedly
the human rate of information processing for the movement task under investigation.
Card, English, and Burr (1978) found IP = 10.4 bits/s for the mouse
in a text selection task. This is similar to values obtained by Fitts (1954)
but is higher than usual. For example, ten devices were tested in studies
by Epps (1986), Jagacinski and Monk (1985), and Kantowitz and Elvers (1988).
Performance indices ranged from 1.1 to 5.0 bits/s.
There is recent evidence that the following formulation is more theoretically
sound and yields a better fit with empirical data (MacKenzie, 1989):
MT = a + b log2(A / W + 1). (3)
In an analysis of data from Fitts' (1954) experiments, Equation 3 was shown
to yield higher correlations than those obtained using the Fitts or Welford
formulation. Another benefit of Equation 3 is that the index of difficulty
cannot be negative, unlike the log term in Equation 1 or 2. Studies by
Card et al. (1978), Gillan, Holden, Adam, Rudisill, and Magee (1990), and
Ware and Mikaelian (1987), for example, yielded a negative index of difficulty
under some conditions. Typically this results when wide, short targets
(viz., words) are approached from above or below at close range. Under
such conditions, A is small, W is large, and the index of
difficulty, computed using Equation 1 or 2, is often negative. A negative
index is theoretically unsound and diminishes some of the potential benefits
of the model.
Fitts' original experiments used reciprocal tapping tasks where one
alternately tapped on two rectangular targets. The controlled variables
were target width and the distance between targets; however, the motion
was one dimensional (back and forth). Extending the model to two dimensions
(which better fits pointing tasks in computer usage) has been discussed
by Card et al. (1978) and Jagacinski and Monk (1985), among others.
Dragging
There is little in the literature addressing human performance in dragging
tasks. One exception is the study by Gillan et al. (1990). Like them, we
extend Fitts' law to dragging. However, their study deals with text selection
and is confounded on issues such as approach angle. Our work is at a lower
level, and pays closer attention to device performance in the respective
tasks and to the formulation of the mathematical model.
Using Fitts' law to model dragging is best explained using an example.
Consider the case of deleting a file on the Apple Macintosh. First, the
user acquires the icon for the file in question. This point/select operation
is a classic two-dimensional target acquisition task. Then, while holding
the mouse button down, the icon is dragged to the trashcan. This also is
a target acquisition task. One is really just acquiring the trashcan icon.
In this case, however, the task is performed with the mouse button depressed.
From the perspective of motor performance, the only difference is whether
the tasks are performed with the mouse button released or held down. (In
both cases, the target is an icon of approximately the same size.) These
classes of action are characterized as State 1 and State 2
by Buxton (1990), as illustrated in Figure 1.
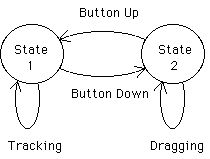
Figure 1. Simple 2-state interaction. In State 1, mouse
motion
moves the tracking symbol. Pressing and releasing the mouse button
over an
icon selects the icon and leaves the user in State 1. Depressing the
mouse
button over an icon and moving the mouse drags the icon. This is a
State 2
action. Releasing the mouse button returns to the tracking state, State
1
(from Buxton, 1990).
State 2 motion on most input devices requires active maintenance of
the state (e.g., by holding down a button), generally restricting the freedom
of movement.[1] Given the frequency of
State 2 actions in direct manipulation systems, we feel the following are
important:
-
to evaluate devices in both State 1 and State 2 tasks (unlike prior
emphasis on the former), and
-
to show that an established model (i.e., Fitts' law) can apply to this
additional, State 2, case.
Achieving these two goals was our main motivation. Mean movement time,
error rate, and Fitts' law were used to compare performance on three input
devices in both State 1 and State 2 tasks.
Method
Subjects
Twelve computer literate subjects (11 male, 1 female) from a local college
served as paid volunteers. Subjects used their preferred hand.
Equipment
Tasks were performed on an Apple Macintosh II using three input devices:
-
Macintosh mouse
-
Wacom tablet and stylus
-
Kensington trackball
Procedure
Pointing Task: Two targets appeared on each side of the screen (see
Figure 2) with an arrow indicating where to begin. Subjects proceeded to
point and click alternately between the two targets as quickly and accurately
as possible, ten times in a row. A beep was heard if selection occurred
outside the target. On each click a box at the top of the screen turned
black while in State 2. (This additional feedback was important with the
stylus to help judge the amount of pressure needed.) Following a one second
pause the next condition appeared.
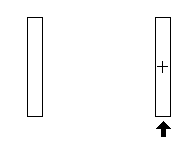
Figure 2. State 1 pointing task. Subjects started at the target
marked by the arrow and alternately selected the targets as quickly
and
accurately as possible. The cross tracked the movement of the input
device.
Dragging Task: The dragging task was similar except an "object"
(see Figure 3) was acquired by pressing and holding down the button (on
the mouse and trackball) or maintaining pressure on the stylus to "drag"
the object to the other target. The object was dropped by releasing the
button or pressure. The new object to be selected appeared immediately
in the centre of the target in which the old object was just dropped.
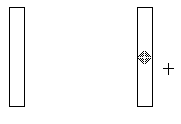
Figure 3. State 2 dragging task. By placing the cross over the
object inside the target, the object could be acquired and dragged
to the other
target. State 2 was maintained by holding the mouse button down.
The dragging task can be likened to an inside-out pointing task: During
pointing, movement occurred with the mouse button up and a down-up action
terminated a move (and initiated the next); during dragging, movement occurred
with the mouse button down and an up-down action terminated a move (and
initiated the next).
Although instructed to move as quickly and accurately as possible, performance
feedback was not provided. Subjects were told that an error rate of one
miss in every 25 trials was optimal.
Design
Both tasks used four target amplitudes (A = 8, 16, 32, or 64 units;
1 unit = 8 pixels) fully crossed with four target widths (W = 1,
2, 4, or 8 units). Each A-W combination initiated of a block of
ten trials, each being one pointing or dragging task. Sixteen randomized
blocks constituted one session. Five sessions were completed for each device
for each task.
The task and device factors were within-subjects -- each subject performed
both pointing and dragging on all three devices. Ordering of devices was
counterbalanced. Within devices, a random process determined the initial
task (dragging or pointing) and tasks alternated for each session thereafter.
Prior to each new device-task condition, subjects were given a practice
block. Breaks were allowed between blocks and sessions, but subjects completed
all ten sessions on each device in a single sitting. Three sittings over
three days, for a total of about three hours, were necessary to complete
all conditions.
Results
Adjustment of Data
Subjects were observed to occasionally "drop" the object during the dragging
task, not through normal motor variability, but because of difficulty in
sustaining State 2 motion. (This was particularly evident with the trackball.)
Thus "dropping errors" were distinguished from motor variability errors.
Examining the distribution of "hits" (the X coordinates) confirmed
this source of error. Figure 4 shows a sample distribution of responses
around the target for one subject during dragging. The data reveal deviate
responses at very short movement distances distinct from the normal variability
expected.

Figure 4. Dropping errors. The distribution of X coordinates
for
one subject showing deviate responses classified as "dropping errors".
Shown
are 50 trials for the trackball during dragging with A= 32 and
W
=
2.
Because dropping errors are considered a distinct behavior, we adjusted
the data by eliminating trials with an X coordinate more than three
standard deviations from the mean. Means and standard deviations were calculated
separately for each subject, and for each combination of width (W),
amplitude (A), device, and task.
We also eliminated trials immediately following deviate trials. The
literature on response times for repetitive, self-paced, serial tasks shows
that deviate responses are disruptive events and can cause unusually long
response times on the following trial (e.g., Rabbitt, 1968)
.A multiple comparisons test indicated a significant drop in movement
time after the first session (p < .05), but no significant difference
in movement time over the last four sessions. Therefore, the first session
for each subject for each device-task condition was also removed. Henceforth,
"adjusted" results are those subject to the above modifications.
Movement Time
Mean movement times for the mouse, tablet, and trackball respectively were
674, 665, and 1101 ms during pointing and 916, 802, and 1284 ms during
dragging. There was a significant main effect for task, with pointing faster
than dragging (F1,11 = 72.4, p < .001). This
is shown in Figure 5. Devices also differed in movement time (F2,22
= 264.0, p < .001). The trackball was the slowest in both pointing
and dragging; however, there was a significant task-by-device interaction
(F2,22 = 4.76, p < .05). While the mouse and
tablet were comparable for pointing, performance was more degraded for
the mouse than for the tablet or trackball when the task changed to dragging.
Adjusting for dropping errors had minimal effect on movement time.
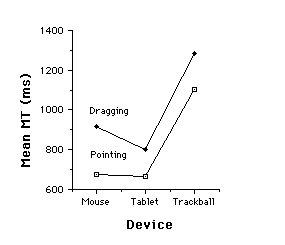
Figure 5. Mean movement time by device and task
Errors
An error was defined as selecting outside the target while pointing, or
relinquishing the object outside the target while dragging. Unadjusted
error rates for pointing were in the desired range of 4% with means of
3.5% for the mouse, 4.0% for the tablet, and 3.9% for the trackball. However,
in the case of dragging, error rates were considerably higher, with means
of 10.8% for the mouse, 13.6% for the tablet, and 17.3% for the trackball.
Figure 6 shows the mean percentage errors by device and task, both adjusted
and unadjusted. The unadjusted data showed a significant main effect of
task, with the dragging task yielding many more errors than the pointing
task (F1,11 = 45.28, p < .001). In addition
there was a significant main effect of device (F2,22
= 7.57, p < .001). This effect, however, was entirely due to
the dragging task as shown by a significant interaction (F2,22
= 16.04, p < .001). While there was no difference in error rate
across devices in the pointing task, error rate in the dragging task was
dependent on device, with the trackball yielding the most errors and the
mouse the fewest.
Adjusting for errors, not surprisingly, had a profound effect on dragging.
By definition, no dropping errors occur in the pointing task; however,
the same criterion was applied for consistency. If valid, not as many errors
would be eliminated in the pointing task. As evident in Figure 6, this
was the case.
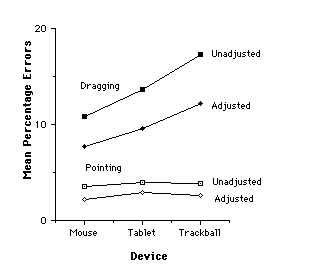
Figure 6. Mean percentage errors by device and task
Fit of the Model
A goal of this experiment was to compare the performance of several device-task
combinations using Fitts' information processing model. Although Fitts'
index of performance (IP, in bits/s) is considered an important
performance metric, the disparity in error rates diminishes the validity
of comparisons across device-task conditions. Clearly (see Figures 5 &
6), subjects were performing at different points on the speed-accuracy
continuum for each device-task condition.
We applied Welford's (1968, p. 147) technique for normalizing response
variability based on subjects' error rate. For each A-W condition,
target width was transformed into an effective target width (We)
-- for a nominal error rate of 4% -- and ID was re-computed. Then,
MT
was regressed on the "effective" ID. Performance differences emerging
from normalized data should be more indicative of inherent device-task
properties. Figure 7 shows the results of such an analysis.
There were consistently high correlations (r) between movement
time (MT) and the index of task difficulty (ID, computed
using Equation 3) for all device-task combinations.[2]
The performance indices (IP), obtained through linear regression,
were less than those found by Card et al. (1978), but are comparable to
those cited earlier. The rank order of devices changed across tasks, with
the tablet outperformed the mouse during pointing but not during dragging.
The differences, however, were slight. The trackball, third for both tasks,
had a particularly low rating of IP = 1.5 bits/s during dragging.
Five of the intercepts were close to the origin (within 135 ms); however,
a large, negative intercept appeared for the trackball-dragging combination
(-349 ms). With a negative intercept, the possibility of a negative predicted
movement time looms. However, the chance of such an erroneous prediction
is remote because of the large slope coefficients. For example, under the
latter condition, a negative prediction would only occur for ID
< 0.5 bits.
====================================================
                         Regression Coefficients

                  ----------------------------------
                   Intercept,  Slope, b   IP
 Device     ra     a(ms)      (ms/bit>   (bits/s)b
----------------------------------------------------
                 *** Pointing ***
Mouse      .990    -107        223        4.5
Tablet     .988     -55        204        4.9
Trackball  .981      75        300        3.3

                 *** Dragging ***
Mouse      .992     135        249        4.0
Tablet     .992     -27        276        3.6
Trackball  .923    -349        688        1.5

=====================================================
 a n = 16, p < .001
 b IP (index of performance) = 1/b
Figure 7. Fitts' law models. A regression analysis for each
device-task combination shows the correlation (r), intercept
(a), slope (b),
and index of performance (IP = 1/b). Prediction equations
are of the form
MT = a + b ID, where ID = log2(A/W
+ 1).
Conclusion
This experiment confirmed the Card et al. (1978) finding of the superb
performance of the mouse for pointing tasks, although the performance was
comparable using a stylus and tablet.
The experiment showed a clear difference with devices in performing
State 1 (pointing) and State 2 (dragging) tasks. For State 2 tasks, movement
times are longer and error rates are higher. The degradation between states
differs across devices.
The trackball was a poor performer for both tasks, and had a very high
error rate during dragging. This can be explained by noting the extent
of muscle and limb interaction required to maintain State 2 motion and
to execute state transitions. The button on the trackball was operated
with the thumb while the ball was rolled with the fingers. It was particularly
difficult to hold the ball stationary with the fingers while executing
a state transition with the thumb: The interaction between muscle and limb
groups was considerable. This was not the case with the mouse or tablet
which afford separation of the means to effect action. Motion was realized
through the wrist or forearm with state transitions executed via the index
finger (mouse) or the application of pressure (tablet). Clearly, in the
design of direct manipulation systems employing State 2 actions, the performance
of devices in both states should be considered.
The experiment also showed that Fitts' law can model both dragging and
pointing tasks; however, performance indices within devices were higher
while pointing. Overall, IP ranged from 1.5 to 4.9 bits/s, somewhat
less than the values found by Card et al. (1978) but comparable to values
in other studies.
Of the devices tested, the highest index of performance was for the
tablet during pointing and for the mouse during dragging. It is felt that
a stylus, despite the requirement of additional, non-standard hardware,
has the potential to perform as well as the mouse in direct manipulation
systems, and may out-perform the mouse when user activities include, for
example, drawing or gesture recognition.
Clearly, the work is not complete, and issues such as extending Fitts'
law to accommodate approach angle need further investigation.
Acknowledgements
We would like to acknowledge the contribution of Pavel Rozalski who wrote
the software, and the members of the Input Research Group at the University
of Toronto.
This research was supported by the Natural Sciences and Engineering
Research Council of Canada, Xerox Palo Alto Research Center, Digital Equipment
Corp., and Apple Computer Inc. We gratefully acknowledge this contribution,
without which, this work would not have been possible.
References
Buxton, W. (1990). A three-state model of graphical input. In D. Diaper
et al. (Eds.), Human-Computer Interaction -- INTERACT '90,
449-456. Amsterdam: Elsevier.
Card, S. K., English, W. K., & Burr, B. J. (1978). Evaluation of
mouse, rate-controlled isometric joystick, step keys, and text keys for
text selection on a CRT. Ergonomics, 21, 601-613.
Card, S. K., Moran, T. P., & Newell, A. (1980). The keystroke-level
model for user performance time with interactive systems. Communications
of the ACM, 23, 396-410.
Epps, B. W. (1986). Comparison of six cursor control devices based
on Fitts' law models. Proceedings of the Human Factors Society 30th
Annual Meeting, 327-331.
Fitts, P. M. (1954). The information capacity of the human motor
system in controlling the amplitude of movement. Journal of Experimental
Psychology, 47, 381-391.
Gillan, D. J., Holden, K., Adam, S., Rudisill, M., & Magee,
L. (1990). How does Fitts' law fit pointing and dragging? Proceedings
of the CHI '90 Conference on Human Factors in Computing Systems, 227-234.
New York: ACM.
Greenstein, J. S., & Arnaut, L. Y. (1988). Input devices.
In M. Helander (Ed.), Handbook of HCI (pp. 495-519). Amsterdam:
Elsevier.
Jagacinski, R. J., & Monk, D. L. (1985). Fitts' law in two
dimensions with hand and head movements. Journal of Motor Behavior,
17, 77-95.
Kantowitz, B. H., & Elvers, G. C. (1988). Fitts' law with
an isometric controller: Effects of order of control and control-display
gain. Journal of Motor Behavior, 20, 53-66.
MacKenzie, I. S. (1989). A note on the information-theoretic basis
for Fitts' law. Journal of Motor Behavior, 21, 323-330.
Milner, N. P. (1988). A review of human performance and preferences
with different input devices to computer systems. In D. Jones & R.
Winder (Eds.), People and Computers IV: Proceedings of the Fourth Conference
of the British Computer Society -- Human-Computer Interaction Group,
341-362. Cambridge, UK: Cambridge University Press.
Rabbitt, P. M. A. (1968). Errors and error correction in choice-response
tasks. Journal of Experimental Psychology, 71, 264-272.
Sellen, A., Kurtenbach, G., & Buxton, W. (1990). The role
of visual and kinesthetic feedback in the prevention of mode errors. In
D. Diaper et al. (Eds.), Human-Computer Interaction -- INTERACT
'90, 667-673. Amsterdam: Elsevier.
Ware, C., & Mikaelian, H. H. (1987). An evaluation of an eye
tracker as a device for computer input. Proceedings of the CHI + GI
'87 Conference on Human Factors in Computing Systems and Graphics Interface,
183-188. New York: ACM.
Welford, A. T. (1968). The fundamentals of skill. London:
Methuen.


