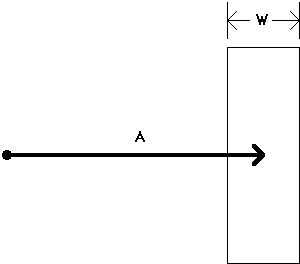
Figure 1. Fitts' law paradigm. The law is inherently one-dimensional
since target amplitude (A) and width (W) are measured
along the same axis.
2Dynamic Graphics Project, Computer Systems Research Institute
University of Toronto
Toronto, Ontario, Canada M5S 1A4
416-978-1961, willy@dgp.toronto.edu
KEYWORDS: human performance modeling, Fitts' law, input devices,
input tasks.
In early applications of the law, an operator manipulated a control (e.g., a lever, slider, or rotary knob) over a specified amplitude to a terminal position of a specified accuracy [e.g., 13]. Since the 1970s, many researchers have adopted a different paradigm. Objects of interest are often "iconic" -- represented on a two-dimensional CRT display and selected by a mouse, joystick, or trackball [e.g., 2, 3, 12]. Unfortunately, and as we shall demonstrate, the law is inherently one-dimensional; so, many such experiments include confounding variables such as approach angle and target shape.
The contribution of the present paper is in extending Fitts' law
to 2D target acquisition tasks and in alleviating common weaknesses in
applying the model. Following a brief introduction, we demonstrate -- with
examples from published research -- that inaccurate, even erroneous, measures
often emerge in typical applications of the model. Modifications are introduced
and an experiment is presented to compare alternative models.
MT = a + b log2(2A/W) (1)where a and b are constants determined through linear regression. W corresponds to "accuracy" -- the required region where an action terminates. The log term is the index of difficulty (ID) and carries the unit "bits" (because the base is 2). If MT is measured in "seconds", then the unit for a is "seconds" and for b, "seconds/bit". The reciprocal of b is the index of performance (IP) in "bits/second". This is the human rate of information processing for the movement task under investigation.
Variations of the law have been proposed by Welford [15],
MT = a + b log2(A/W + 0.5), (2)
and MacKenzie [10, 11],
MT = a + b log2(A/W + 1). (3)These equations differ only in the formulations for ID. On the whole, Equation 3, known as the Shannon formulation, is preferred because it

Figure 1. Fitts' law paradigm. The law is inherently one-dimensional
since target amplitude (A) and width (W) are measured
along the same axis.
Most Fitts' law research employs a task paradigm consistent with Figure
1 [e.g., 9, 14, 12]. However, many investigations vary the angle of approach
to "smooth over" or to investigate directional effects [e.g., 1, 3, 8].
If the targets are circles (or perhaps squares), then the 1D constraint
in the model remains largely intact (because the "width" of a circle is
the same, regardless of the angle of measurement). However, if targets
are rectangles, such as words, the situation is confounded. The amplitude
is still the distance to the centre of the target; but the role of target
width is unclear. This is illustrated in Figure 2.
If the approach angle is 0° (Figure 2a), then the 1D scenario applies.
If the approach angle is 90° (Figure 2b), then the roles of width and
height reverse (from the perspective of the model). Unfortunately, this
has not been accommodated in past research. Card et al. [2], for example,
tested several devices in a text selection task and varied the angle of
approach. The horizontal measurement was always considered the target "width",
regardless of approach angle; so, some unusual interpretations of task
difficulty (ID) emerged. For example, when selecting a 10-character
(2.46 cm) target from a distance of 1 cm, ID was calculated using
Welford's formulation as log2(A/W + 0.5) = log2(1/2.46
+ 0.5) = -0.14 bits. This unreasonable value, although not explicitly cited,
appeared in the scatter plot of MT vs. ID (Fig. 6, p. 609).
In another Fitts' law experiment using similar conditions, Gillan, Holden,
Adam, Rudisill, and Magee [6] required subjects to select a target 26 characters
(6 cm) wide from a distance of 2 cm. Again, Welford's formulation was used,
so ID was log2(2/6 + 0.5) = -0.26 bits.
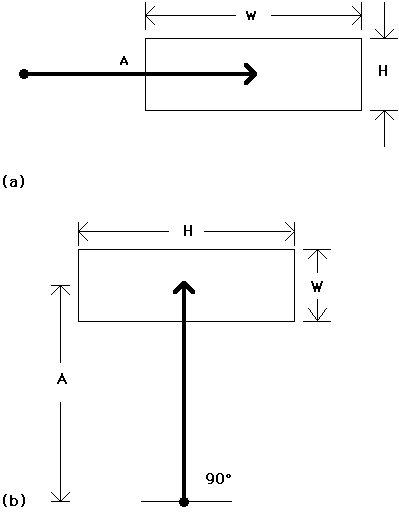
Figure 2. Fitts' law in 2D. The roles of width and height reverse
as
the approach angle changes from 0°. to 90°.
Obviously, a negative rating for task difficulty poses a serious theoretical
problem. (What does "negative difficulty" mean?). We suggest two complementary
ways to correct this. The first is to use the Shannon formulation in calculating
ID
(see Equation 3). For example, under the condition cited above (A
= 2 cm, W = 6 cm), ID becomes log2(2/6 + 1) =
+0.42 bits. It is easily shown that the Shannon formulation always yields
a positive (or zero) ID. Using the Fitts or Welford formulation,
however, the rating is negative when the A:W ratio drops below 1:2.
A second and additional strategy is to substitute for W a measure
more consistent with the 2D nature of the task. Consider Figure 3. The
inherent 1D constraint in the model is maintained by measuring W
along the approach axis. This is shown as W' (read "W prime") in
the figure. Notwithstanding the assertion that subjects may "cut corners"
to minimize distances, the W' model is appealing because it allows
a 1D interpretation of a 2D task.
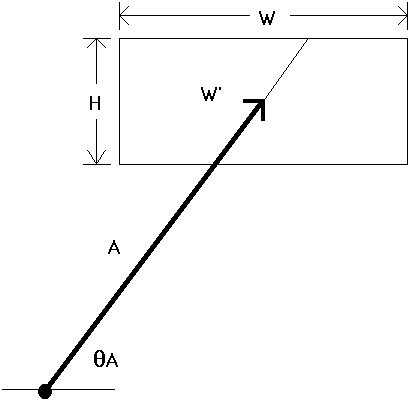
Figure 3. What is target width? Possibilities include W'
(the
width of the target along an approach vector) or the smaller of W
or H.
Another possible substitution for target width is "the smaller of W or H". This pragmatic approach has intuitive appeal in that the smaller of the two dimensions seems more indicative of the accuracy demands of the task. We call this the "SMALLER-OF" model. This model is computationally simple since it can be applied only knowing A, W, and H. The W' model, on the other hand, requires A, W, H, THETA-A, and a geometric calculation to determine the correct substitution for W (see Figure 3).
The objective of the present research was to test the viability of the W' and SMALLER-OF models as alternatives to a "STATUS QUO" model, whereby W is always the horizontal extent of a target. As well, two other models were considered. Gillan et al. [6] although addressing different issues, tested W+H and WxH as possible substitutions for target width. The area model (WxH) has some appeal, since it is not limited to rectangular targets, and since area also seems to reflect the accuracy demand of the task. Substituting W+H seems implausible, however. Gillan et al. [6] justified W+H because it represents "the border of the text object closest to the start button" (p. 231).
In the following paragraphs, we describe an experiment that was conducted
to test the models described above. A target selection task was used with
rectangular targets approached from various angles.
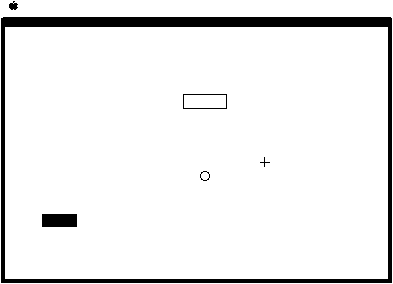
Figure 4. Sample experimental condition.
If a move started before the solid bar stabilized, a beep was heard
and the subject restarted the move. Subjects were instructed to balance
speed and accuracy for an error rate around 4%. An examiner was present
for all trials.
Only 78 of 240 possible cells were used. This kept the experiment manageable and exhausted a wide and important range of conditions. Twenty-six amplitude/size conditions (see Figure 5) were crossed with the three approach angles. Conditions with W = H (viz., squares) were excluded since they yield only small differences in IDs among the models tested. Amplitudes were selected in power-of-four increments starting at the larger of W or H. The latter requirement ensured that the starting position was outside the target for all approach angles.
===========================================

                    Amplitudea

               -------------------

Width   Height  2   4   8   16  32   No.

-------------------------------------------

  2     1      *   .   *   .   *     3
  4     1      .   *   .   *   .     2
  8     1      .   .   *   .   *     2
  1     2      *   .   *   .   *     3
  4     2      .   *   .   *   .     2
  8     2      .   .   *   .   *     2
  1     4      .   *   .   *   .     2
  2     4      .   *   .   *   .     2
  8     4      .   .   *   .   *     2
  1     8      .   .   *   .   *     2
  2     8      .   .   *   .   *     2
  4     8      .   .   *   .   *     2

                                  --------

                          Total     26

============================================

 a * = condition used; . = condition not used
The 78 conditions were presented in random order until all were exhausted.
This constituted one block. Fifteen blocks were administered over four
days (3 + 4 + 4 + 4) for a total of 1170 trials per subject.
Trials were timed from the cursor leaving the start circle to the button-down action at the target. The grand mean for movement time was 743 ms. Moves along the horizontal and vertical axes were about the same (733 & 732 ms) while moves along the diagonal axis took 4% longer (MT = 764 ms, F2,22 = 23.86, p < .001).
Error rates were very close the optimal rating of 4%. The grand mean was 4.6%, with means along the horizontal, diagonal, and vertical axes of 3.9%, 5.1%, and 4.7% respectively. Statistical significance was achieved (F2,22 = 4.33, p < .05).
The above results were expected based on previous findings [e.g., 2].
Although the differences should be noted, they do not give one model an
advantage since a range of short-and-wide and tall-and-narrow targets were
used.
     Model           Target Width

     ------------------------------------------

     STATUS QUO      horizontal extent (W)
     W+H            sum of width and height
     WxH            area
     SMALLER-OF      smaller of width or height
     W'             width  along line of approach
Each model was entered in a test of correlation and linear regression using the Shannon formulation for index of difficulty. The results are given in Figure 6.
================================================================================

                                               Regression  Coefficients

               ID Range (bits)         -----------------------------------------

 Model for     ----------------          SEb  Intercept,   Slope, b     IP
 Target Width    Low    High      ra    (ms)   a (ms)       (ms/bit)     (bits/s)
--------------------------------------------------------------------------------
 SMALLER-OF      1.58   5.04    .9501    64    230          166          6.0
 W '             1.00   5.04    .9333    74    337          160          6.3
 W+H             0.74   3.54    .8755    99    402          218          4.6
 WxH             0.32   4.09    .8446    110   481          173          5.8
 STATUS QUO      1.00   5.04    .8097    121   409          135          7.4
================================================================================
 a n = 78, p < .001
 b standard error of estimate
==============================================================================

Comparison of Models for           Correlations of ID             Hotelling
    Target Width                   with Movement Time             t testa
------------------------  ----------------------------------    ------------
1st Model    2nd Model    1st Model   2nd Model  Inter-Model     t     p
------------------------------------------------------------------------------
SMALLER-OF   W'            .9501      .9333      .8502           1.32  -
SMALLER-OF   STATUS QUO    .9501      .8097      .7881           6.31  .001
W'           STAUTS QUO    .9333      .8097      .6992           4.86  .001
==============================================================================
 a two-tailed test, n = 78, df = 75
The correlations were above .8000 (p < .001) in all cases.
The SMALLER-OF model had the highest correlation and the lowest standard
error, while the STATUS QUO model (W) had the lowest r and
the highest SE. Correlations and SEs for the W' model
were comparable to those for the SMALLER-OF model. Performance indices
(IP) were in the range of 4.6 to 7.4 bits/s. The intercepts were
all positive with the SMALLER-OF model yielding the intercept closest to
the origin.
The highest correlation in Figure 6 was for the SMALLER-OF model. Using
this model we conclude that the predicted time (ms) to point to and select
a rectangular target, regardless of approach angle, is
MT = 230 + 166 log2(A/W + 1), (4)where W is the smaller of the target's width or height. Furthermore, the standard error of estimate can provide a 95% confidence window on the prediction. For example, a task rated at 5 bits of difficulty should take 230 + 166(5) +/- 2(64) ms; that is, between 932 ms and 1188 ms.
The correlations for the STATUS QUO, SMALLER-OF, and W' models
are compared in Figure 7. As evident, the correlation was significantly
higher for the SMALLER-OF and W' models than for the STATUS QUO
model (p < .001). Furthermore, the SMALLER-OF and W' models
did not differ significantly from each other (p > .05). An initial
conclusion, therefore, is that the SMALLER-OF and W' models are
empirically superior to the STATUS QUO model. As noted earlier, the W'
model is theoretically attractive since it retains the one-dimensionality
of the model. In a practical sense, the SMALLER-OF model is appealing because
it can be applied without consideration of approach angle. This is also
true of the STATUS QUO model, but not of the W' model.
On generality, the same argument applies in comparing the SMALLER-OF
and the W' models. Although applying the W' model requires
A,
W,
H, and THETA-A, the SMALLER-OF model only considers
A,
W, and H. This is both a strength and a potential weakness
in the SMALLER-OF model. Perhaps angles between 0° and 45°, for
example, would yield variations in movement time more consistent with the
W' model than the SMALLER-OF model. This remains to be tested. Nevertheless,
the simplicity in applying the SMALLER-OF model with one less parameter
is noteworthy.
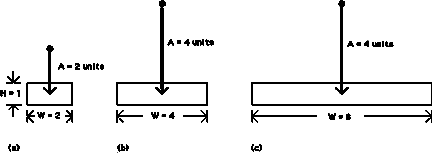
Figure 8. Three sample tasks. Is task (a) harder than task (b)?
Is task (b) harder than task (c)? See text.
By a STATUS QUO model, ID is a function only of A and W, where W is the width of the text object. So, as the number of characters increases, ID decreases (see Equations 1, 2, & 3) and, therefore, the predicted MT decreases. Is this a reasonable expectation? Intuitively, yes. After all, the larger a word, the easier it is to select! Upon closer examination however, it is evident that expectations disagree with predictions.
Considering only the STATUS QUO model initially, it is easy to demonstrate that erroneous predictions follow under extreme, yet reasonable, conditions. As noted earlier, a negative ID emerges using the Fitts or Welford formulation when A:W is less than 1:2. Although improbable for 1D tasks, this situation is perfectly common for 2D tasks. Using the Shannon formulation the limit in ID as W --> INFINITY is 0 bits. This seems reasonable, but as we now demonstrate, the rating for ID, although not negative, can become unrealistically low in 2D tasks using a STATUS QUO interpretation of target width.
Figure 8 is a clear refutation of applying the status quo definition -- that width = horizontal extent. Intuitively, target selection time for task (a) will be somewhat less than for task (b). But this is not predicted by a STATUS QUO model. Intuitively, target selection time for task (b) should be about the same as for task (c). Again, this is not predicted by a STATUS QUO model. Predictions do match expectations if the task difficulties are computed using the SMALLER-OF or W' model.
For further evidence, we need only examine the observations of Gillan
et al. [6], who used conditions of W = 0.25, 1.0, 3.5, and 6.0 cm
with H held constant at 0.5 cm (the height of a character). The
targets were words or phrases of length 1, 5, 14, or 26 characters. The
contour lines in Figure 9 support the SMALLER-OF model over the STATUS
QUO model. The observed selection time decreased from the 1-character to
the 5-character conditions for each amplitude condition (as expected for
both models); however, MT remained the same across the 5-, 14-,
and 26-character conditions. The latter effect, although not accounted
for by the STATUS QUO model, is fully expected with the SMALLER-OF model
because the target height was unchanging and consistently smaller than
the target width. Gillan et al.'s [6] data clearly show that MT
depends on A but not on W over the latter three conditions.
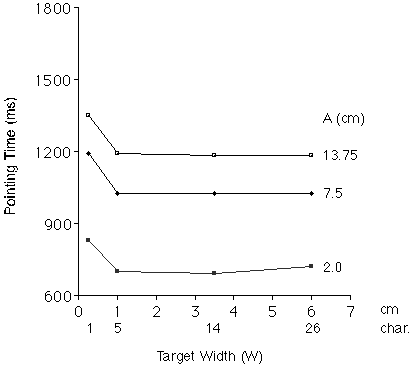
Figure 9. Results from Gillan et al. [6]. Movement time for
the larger
three targets (where H < W) depends only on pointing
distance,
as consistent with the SMALLER-OF model.
Optimization trends were investigated by calculating the actual amplitudes and approach angles for all 78 conditions. As expected, optimization was most evident for the extreme short-and-wide and tall-and-narrow targets. The largest deviation occurred under the condition W = 1, H = 8, A = 8, and THETA-A = 45°, where means for the actual amplitude and approach angle were 7.1 units and 36.9°. For the vast majority of conditions, however, actual amplitudes and angles were remarkably close to the specified conditions. Analyses using actual measures for A and THETA-A were not pursued further.
When non-rectangular targets are used, applying the SMALLER-OF model is problematic; whereas, the W' model is applied in the usual way. Nevertheless, one can imagine odd-shaped targets without an obvious "centre". The W' model may yield unreasonably large or small estimates for target width in some instances. The area model (W x H) has some intuitive appeal in this case. Perhaps an odd-shaped target should be reduced to a minimum-circumference shape -- a circle -- having the same area. The WxH model would substitute the area for W, while the W' model would substitute the diameter.
The Fitts and Welford formulations suffer by yielding a negative rating for a task's index of difficulty, particularly in 2D tasks since the A:W ratio can be very small. The Shannon formulation alleviates this by always providing a positive (or zero) rating for ID.
Consistently using the horizontal extent of a target as its "width"
(the STATUS QUO view) also weakens the model and leads to inaccurate and
sometimes erroneous predictions. Two models performed significantly better
than the STATUS QUO model. The first -- the W' model -- substitutes
for W the extent of the target along an approach vector through
the centre. This model is theoretically attractive since it retains the
one-dimensionality of Fitts' law; however, the approach angle (as well
as the width, height, and amplitude) must be known a priori. The second
-- the SMALLER-OF model -- substitutes for W either the width or
height of the target, whichever is smaller. This model is easy to apply,
but is limited to rectangular targets, unlike the W' model. Both
models, in tests of correlation, performed significantly better than the
STATUS QUO model; however, no difference was detected between them. These
findings should prove useful in subsequent applications of Fitts' law to
target acquisitions tasks on computing systems with graphical user interfaces.
2. Card, S. K., English, W. K., & Burr, B. J. (1978). Evaluation of mouse, rate-controlled isometric joystick, step keys, and text keys for text selection on a CRT. Ergonomics, 21, 601-613.
3. Epps, B. W. (1986). Comparison of six cursor control devices based on Fitts' law models. Proceedings of the 30th Annual Meeting of the Human Factors Society, 327-331.
4. Fitts, P. M. (1954). The information capacity of the human motor system in controlling the amplitude of movement. Journal of Experimental Psychology, 47, 381-391.
5. Fitts, P. M., & Peterson, J. R. (1964). Information capacity of discrete motor responses. Journal of Experimental Psychology, 67, 103-112.
6. Gillan, D. J., Holden, K., Adam, S., Rudisill, M., & Magee, L. (1990). How does Fitts' law fit pointing and dragging? Proceedings of the CHI '90 Conference on Human Factors in Computing Systems, 227-234. New York: ACM.
7. Guilford, J. P., & Fruchter, B. (1978). Fundamental statistics in psychology and education (6th ed.). New York: McGraw-Hill.
8.Jagacinski, R. J., & Monk, D. L. (1985). Fitts' law in two dimensions with hand and head movements. Journal of Motor Behavior, 17, 77-95.
9. Jellinek, H. D., & Card, S. K. (1990). Powermice and user performance. Proceedings of the CHI '90 Conference on Human Factors in Computing Systems, 213-220. New York: ACM.
10. MacKenzie, I. S. (in press). Fitts' law as a research and design tool in human-computer interaction. Human-Computer Interaction.
11.MacKenzie, I. S. (1989). A note on the information-theoretic basis for Fitts' law. Journal of Motor Behavior, 21, 323-330.
12. MacKenzie, I. S., Sellen, A., & Buxton, W. (1991). A comparison of input devices in elemental pointing and dragging tasks. Proceedings of the CHI '91 Conference on Human Factors in Computing Systems, 161-166. New York: ACM.
13. Sheridan, T. B., & Ferrell, W. R. (1963). Remote manipulative control with transmission delay. IEEE Transactions on Human Factors in Electronics, 4, 25-29.
14. Ware, C., & Mikaelian, H. H. (1989). A evaluation of an eye tracker as a device for computer input. Proceedings of the CHI+GI '87 Conference on Human Factors in Computing Systems and Graphics Interface, 183-188. New York: ACM.
15. Welford, A. T. (1968). Fundamentals of skill. London: Methuen.