MacKenzie, I. S., & Buxton, W. (1994). The prediction of pointing and dragging times in graphicaluser interfaces. Interacting with Computers, 6, 213-227.
1Dept. of Computing & Information Science
University ofGuelph
Guelph, Ontario
Canada N1G 2W1
2Computer Systems Research Institute
University ofToronto
Toronto, Ontario
Canada M5S 1A4
An experiment is described demonstrating that the point-drag sequencecommon on interactive systems can be modeled as two separate Fitts' law tasks-- a point-select task followed by a drag-select task. Strong predictionmodels were built; however, comparisons with previous models were not as closeas the standard error coefficients implied. Caution is therefore warranted infollow-up applications of models built in research settings. Additionally, theprevious claim that "target height" is the appropriate substitute for targetwidth in calculating Fitts' index of difficulty in dragging tasks was notsupported. The experiment described herein varied the dragging target's widthand height independently. Models using the horizontal width of the drag targetor the smaller of the target's width or height outperformed the target heightmodel.Keywords: interaction techniques, pointing and dragging tasks,Fitts' law, human performance modeling
The graphical user interface, popularized in 1983 with the introduction ofthe Apple Macintosh, has redefined the way humans interact withcomputers. Present-day mouse-driven interfaces employ sophisticated yetnatural techniques for user input. "Pointing", "dragging", "inking", etc.,form the core repertoire of interaction techniques in graphical userinterfaces.
This paper presents and critiques prediction models for the common tasks ofpointing and dragging. Our aim is (a) to illustrate the potential benefits andproblems in using Fitts' law models as an engineer's approximate model as perCard, Moran, and Newell's (1983) Model Human Processor, and (b) toestablish which target dimension is the most appropriate "target width" forpointing and dragging tasks on a 2D CRT display. We will present models frompast research, describe an experiment building new models, and compare andreconcile the differences between these models.
Just as language is a tool for thought, models are tools for organizing andarticulating ideas for the researcher or designer. One such model thatcaptures the common acts of pointing and dragging in interactive systems is theThree-State Model for Graphical Input (Buxton, 1990). Pointing is representedas a State 1 action and dragging as a State 2 action (see Figure 1).Selection is a brief transition from State 1 to State 2 and backagain via a mouse button. (State 0 actions are the "out-of-range" motionspossible with a mouse or stylus while airborne.) The three-state model forms avocabulary for exploring relationships -- affordances or constraints -- betweeninput devices and interactive techniques.
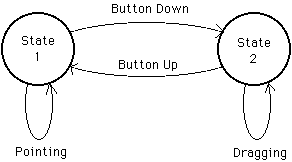
Figure 1. Simple two-state interaction. In State 1, mouse motion moves
the tracking symbol. Pressing and releasing the mouse button over
an icon selects the icon and leaves the user in State 1. Depressing the
mouse button over an icon and moving the mouse drags the icon. This is a
State 2 action. Releasing the mouse button returns to the pointing state. From Buxton (1990).
The three-state model is descriptive. As a predictive model we call uponFitts' law, an information processing model for human motor-sensory behaviour(Fitts, 1954). Prediction models are important for HCI since they allowinterface scenarios to be explored a priori. Performance measures canbe estimated "on paper" with choices formed early in the design process. Thepresence of Fitts' law as one of nine principles of operation in Card, Moran,and Newell's (1983) Model Human Processor has inspired substantial useof the law by HCI researchers.Although Fitts' law has surfaced extensively as a prediction model forpointing tasks, its application to dragging tasks is limited to the studies byGillan, Holden, Adam, Rudisill, and Magee (1990, 1992) and MacKenzie, Sellen,and Buxton (1991). We will review these following a brief introduction toFitts' law. For extensive reviews, see MacKenzie (1992), Meyer, Smith,Kornblum, Abrams, and Wright (1990), or Welford (1968).
According to Fitts (1954), a movement tasks' index of difficulty(ID) can be quantified using information theory by the metric "bits".Specifically,
MT = log2(2A/W) (1)A is the distance or amplitude to move and W is thewidth or tolerance of the region within which the move terminates. FromEquation 1, the time to complete a movement task is predicted as
MT = a + b ID (2)
where a and b are the intercept and slope coefficients fromlinear regression.Variations of Fitts' law have surface to correct systematic biases inregression analyses. These include the Welford (1968) formulation:
MT = a + b log2(A/W + 0.5) (3)
and the Shannon formulation (MacKenzie, 1989): MT = a + b log2(A/W + 1) (4)
Equation 4 is preferred because it(a) provides a slightly better fit with observations,
(b) exactly mimics the information theorem underlying Fitts' law,and
(c) always gives a positive rating for ID.
The experiments undertaken by Fitts and most other experimentalpsychologists tested one dimensional movements. HCI researchers generally usetarget selection tasks on a two-dimensional CRT display. The shape of thetarget and the angle of approach, therefore, must be considered in applying themodel. For rectangular targets, we still view the amplitude as the distance tothe target's centre, but the definition of target width is unclear. This isillustrated in Figure 2.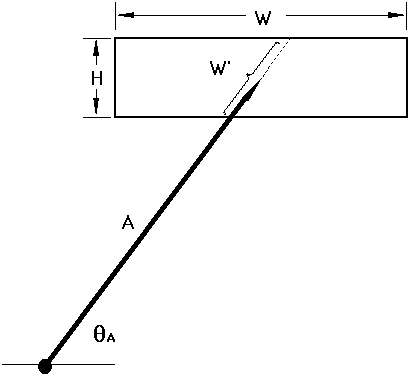
Figure 2. The two-dimensional problem: What is target width?
Possibilities include the horizontal extent of the target (the STATUS QUO
model), the smaller of the target's width or height (the SMALLER-OF model), or
the length of the target along the approach axis (the W' model).For 2D tasks, the question arises: What is target width? The defaultstrategy is to consistently use the horizontal extent of the target. We callthis the "STATUS QUO" model for target width. Unfortunately, aSTATUS QUO model yields unrealistically low (sometimes negative!)estimates for task difficulty when, for example, a short and wide target suchas a word approached from above or below at close range. At least two examplesof this exist in the literature (see MacKenzie, 1992).We suggest two ways to correct this. The first is to use the Shannonformulation for ID, which always yields a positive rating for ID.A second and additional strategy is to substitute for W a measure moreconsistent with the 2D nature of the task. In Figure 2 the inherent 1Dnature of the model is maintained by measuring W along the approachaxis. Shown as W' in the figure, we call this the "W' model".The W' model is appealing because it allows a 1D interpretation of a 2Dtask, thus maintaining the theoretical premise of the law.
Another possible substitution for target width is "the smaller of W or H".This pragmatic approach has intuitive appeal in that the smaller of the twodimensions seems more indicative of the accuracy demands of the task. We callthis the "SMALLER-OF" model.
We conducted an experiment to test the different models for target width ona standard 2D target selection task using a mouse (MacKenzie and Buxton, 1992).The design employed a balanced range of short-and-wide and tall-and-narrowtargets approached from various angles. The results indicated that both theSMALLER-OF and W' models are empirically superior to the STATUS QUOmodel and that the difference between the SMALLER-OF and W' models isinsignificant. The model with the highest correlation was
MT = 230 + 166 log2(A/W + 1) (5)
where W equaled the smaller of W or H (SMALLER-OFmodel). Equation 5 had a correlation of r = .950 and a standarderror of estimate of SE = 63 ms. The latter measure is important inestablishing confidence intervals for subsequent applications of Fitts' lawmodels as engineering tools.For further evidence, we need only examine the observations of Gillan etal. (1990, 1992), who used conditions of W = 0.25, 1.0, 3.5, and 6.0 cmwith H held constant at 0.5 cm (the height of a character). The targetswere words or phrases of length 1, 5, 14, or 26 characters. The observedselection time decreased from the 1-character to the 5-character conditions foreach amplitude condition (as expected for both models); however, MTremained the same across the 5-, 14-, and 26-character conditions. The lattereffect, although not accounted for by the STATUS QUO model, is fullyexpected with the SMALLER-OF model because target height was constant andconsistently smaller than target width.
An important task in graphical user interfaces is the point-drag sequence.This is illustrated in Figure 3 for the common action of selecting a blockof text.
Figure 3. The point-drag sequence. The task has two components: a
point-select task ending with the button-down action, and a drag-select task
ending with a button-up action.Selecting the phrase "An apple a day" requires, first, a point operation(State 1) terminating with a button-down action on the letter "A", andsecond, a drag operation (State 2). The drag operation is a motionthrough the block of text with the button held down, terminating in the regionof the last character in the block. We consider this two separate Fitts' lawtasks, a point sequence followed immediately by a drag sequence. For eachcomponent of the move, the width of the target (W) should be modeledusing the SMALLER-OF or W' models, as described earlier. In both cases,the rectangular region containing a single character is the target.If the angles of movement change or if the text block covers several lines,the approach angles (and W') change somewhat, but the two-dimensionalextensions discussed above still apply (Figure 4). The model is appliedexactly the same for other point-drag sequences, such as pull-down menus orscroll bars.
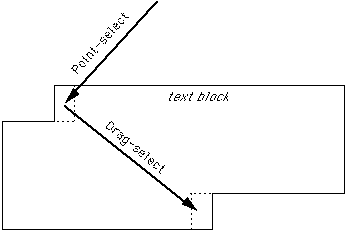
Figure 4. The point-drag sequence in two dimensions. For the point-select and
drag-select tasks, the target is the region containing a single character.Fitts' Law in Dragging TasksThe studies by Gillan et al. (1990, 1992) and MacKenzie et al.(1991) are the only existing applications of Fitts' law to dragging tasks.Gillan et al. (1990, 1992) tested Fitts' law in point-select andpoint-drag-select tasks. They concluded that "dragging time in a point-dragsequence is under control of two features of a computer display: the draggingdistance and the height of the text object" (1990, p. 232). Two models werecompared: one substituting the constant 0.5 cm for target width andanother substituting target height, H. A higher correlation was foundin the latter case, and this led to the conclusion above. We are suspicious ofthe "target height" model because character width was positively correlatedwith character height. It is felt that Gillan et al. (1990) inadvertentlyconfirmed the strength of the STATUS QUO model for one-dimensional tasks.In a subsequent paper, they concluded that "dragging time was affected by bothdragging distance and the font size of the text object" (1992, p. 306). Thisis a more reasonable conclusion, however it is not generalizable to draggingtasks with arbitrary targets such as scroll bars or menus.
In the only other test of Fitts' law in dragging tasks, MacKenzie et al.(1991) tested serial pointing and dragging and found a slightly less efficientrate of information processing during dragging than during pointing (3.0 bits/svs. 4.2 bits/s). A serial task similar to Fitts (1954) was employed, so themodels of are restricted practical use. However, since dragging immediatelyfollows pointing in the point-drag sequence, the serial dragging model may beappropriate in this limited case. The mouse-dragging model was
MT = 135 + 249 log2(A/W + 1) (6)
with r = .992 and SE = 38 ms. Equation 6 for dragging,and the pointing model presented earlier (Equation 5), will be testedlater against the models from the experiment described in the nextsection.In this section we describe an experiment using a point-select (State 1)task followed by a drag-select (State 2) task. It is claimed that the effectis that of two Fitts' law tasks in sequence. Two prediction equations shouldapply, reflecting the inherent information processing capacities in eachtask.
Twelve male students from a local college volunteered as subjects and werepaid an hourly rate. All subjects used computers on a daily basis.An Apple Macintosh II microcomputer served as the host computer withinput through a standard mouse. The output display was a 33 cm colour CRTmonitor (used in black-and-white mode) with a resolution of 640 by 480pixels.Subjects performed multiple trials of a simple point-drag-select task. Thetask was demonstrated prior to starting and a block of warm-up trials wasadministered prior to data collection.For each trial, a small circle appeared near the centre of the CRT display,and a target, in the form of a horizontal scroll bar, appeared elsewhere (seeFigure 5). Subjects were instructed to manipulate the mouse to move the cursorinside the circle, then wait for a visual cue before beginning. The cue was asmall black rectangular bar which appeared on the left of the screen (seeFigure 5) and slowly expanded in size for about 1 second. After the barstabilized, a move could begin. Subjects could take as long as necessary toprepare for each move, but were told to move as quickly and accurately aspossible once the cursor left the circle. The graduating cue prevented themfrom treating the experiment as a reaction time task as its end point, thestart signal, was not well defined.
Timing began when the cursor left the circle. The task was a point-selectaction followed immediately by a drag-select action. For the point-selectaction, subjects acquired the left rectangle in the horizontal bar (at the topin Figure 5). For the drag-select action subjects dragged the rectanglehorizontally and deposited it in the right rectangle. The procedure resembledthe operation of a horizontal scroll bar on the Macintosh though no scrollingresulted.
The point-select task was timed from the cursor leaving to the start circleto the button-down action in the left rectangle of the horizontal bar. Thedrag-select task was timed from the button-down action terminating thepoint-select task to the button-up action where the rectangle was dropped onthe right. A pointing error was recorded if the button-down action was outsidethe left rectangle. A dragging error occurred if the two rectangles did notoverlap when the button-up action occurred.
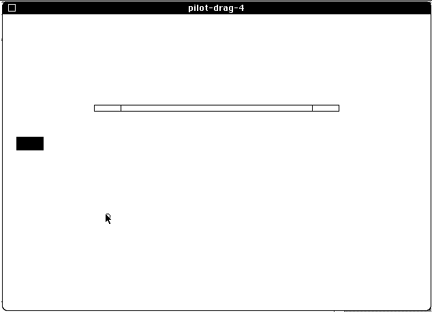
Figure 5. The experimental task. Subjects began by positioning the
cursor inside the small circle. The point-select sequence terminated with a
button-down action in the left rectangle. The drag-select sequence terminated
with a button-up sequence in the right rectangle after dragging across the
horizontal bar. The left rectangle moved with the cursor during the drag operation.If a move started before the bar stabilized, a beep was heard and thesubject had to reposition the cursor inside the circle and restart themove.A fully within-subjects repeated measures design was used. Controlledvariables were approach angle (THETA-A = 0°,45°, & 90°), point amplitude (A1 = 2, 4, 8, 16, &32 units), drag amplitude (A2 = 2, 4, 8, 16, & 32 units), targetwidth (W = 1, 2, 4, & 8 units), and target height (H = 2& 4 units). Each experiment unit equaled 10 pixels. The greatesthorizontal distance covered was 480 pixels (8.0 cm), corresponding to A1= 16 units, A2 = 32 units, and THETA-A =0°. Dependent variables were movement time (MT) and error rate.Measurements were taken separately for the pointing and dragging components ofeach move. Movement time for the initial point operation (MTP) wastimed from the cursor leaving the start circle to the button-down action at thepick-up region on the left of the target (see Figure 5). Movement time fordragging (MTD) was timed from the end of the point operation to thebutton-up action at the drop region on the right.Only 102 of 600 possible cells were used to keep the experiment manageableand to exhaust a wide and relevant range of test conditions. Thirty-fourdistance/size conditions (see Table 1) were crossed with the threeapproach angles. Drag amplitudes were selected in power-of-four incrementsstarting at 2 x W. This provided at least W units ofseparation between the pick-up and drop regions for dragging.
Table 1
Distance/Size Conditions Used in Experiment========================================================================== Point Amplitudea Drag Amplitudea ------------------ ------------------ Width Height 2 4 8 16 32 2 4 8 16 32 Combinations-------------------------------------------------------------------------- 1 2 x . x . x x . x . . 6 2 2 x . x . x . x . x . 6 4 2 . x . x . . . x . x 4 8 2 . . x . x . . . x . 2 1 4 . x . x . x . x . x 6 2 4 . x . x . . x . x . 4 4 4 . x . x . . . x . x 4 8 4 . . x . x . . . x . 2 Total 34 =========================================================================== a x = used; . = not used (Note: point and drag conditions crossed)
The 102 conditions were presented in random order until all conditions wereexhausted. This constituted one block. A total of 15 blocks were administeredover four days for a total of 1530 trials per subject.The mean time to complete moves was 633 ms (SD = 213 ms) for thepointing phase of tasks followed by 827 ms (SD = 226 ms) for thedragging phase. Mean error rates were 1.8% (SD = 3.7%) for pointing and4.2% (SD = 6.0%) for dragging.
Although 102 unique conditions were tested (see Table 1), the data wereaggregated by conditions unique to each of the pointing and dragging phases ofthe tasks. Aggregating by point-amplitude, width, height, and angle left 54conditions for the pointing analysis. Aggregating by drag-amplitude, width,and height left 15 conditions for the dragging analysis. Regressing MTP(ms) on ID, where ID = log2(A/SOWH + 1),yielded
MTP = 177 + 169 ID (7)
with r = .9637 (p < .001) and SE = 54 ms.[1] Regressing MTD (ms) on ID,where ID = log2(A/W + 1), yielded MTD = 345 + 198 ID (8)
with r = .9711 (p < .001) and SE = 54 ms. The highcorrelations in these analyses are, in themselves, support for the hypothesisthat point-drag-select tasks can be modeled as two separate Fitts' law tasks,each with its own prediction equation.A goal of this experiment was to take prediction equations built inprevious research and test their potential as engineering tools to predictsubsequent behaviour in a different setting. Accordingly, the predictionequations and standard error of estimates from previous models for pointing(MacKenzie & Buxton, 1992, Equation 5) and dragging (MacKenzie et al.,1991, Equation 6) are compared with the equations from the presentexperiment.A scatter plot of points is shown in Figure 6 for pointing and in Figure 7for dragging. Each point plotted was derived from the mean of more than 300observations. The dashed lines apply to the present experiment, with the rangeof conditions delimited on the left and right, and the 95% confidence intervals(on observed points) delimited on the top and bottom. The solid lines show the95% confidence intervals predicted from the earlier models.
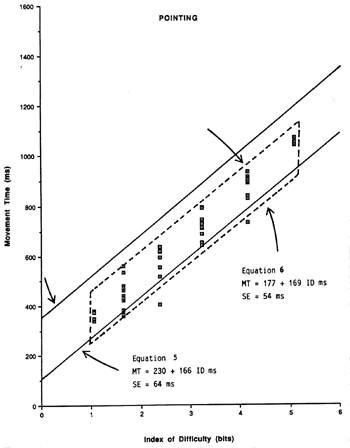
Figure 6. Model comparison for the point-select sequence. The scatter plot
and dashed lines are for the current experiment (Equation 7). The solid lines
delimit the 95% confidence intervals from a previous experiment (Equation 5).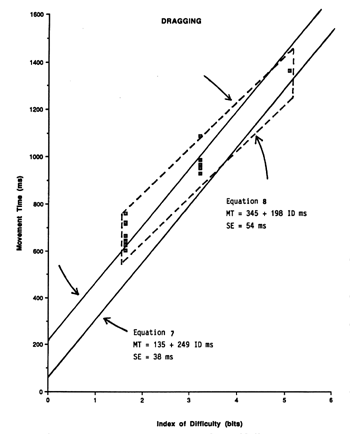
Figure 7. Model comparison for the drag-select sequence. The scatter plot
and dashed lines are for the current experiment (Equation 8). The solid lines
delimit the 95% confidence intervals from a previous experiment (Equation 6).Of the 54 aggregate points for pointing, four (8.9%) were below thepredicted 95% confidence band from Equation 5; none was above. Of the 15aggregate points for dragging, eight (53.3%) were above the predicted 95%confidence band from Equation 6; none was below.The use of a model derived from a serial dragging task (Equation 6)may be inappropriate for the dragging phase of a discrete point-drag-selecttask. It is evident in Figure 7 that Equations 6 and 8 have verydifferent intercepts and slopes. The regression coefficients and standarderrors (SEs) for the predictions equations and for each regressioncoefficient are summarized in Table 2 for the four equations inquestion.
Table 2
Comparison of Four Regression Coefficients============================================================================== Regression Coefficients ------------------------------------------------------ SE Intercept, SE Slope, SE IP(bits Equation ra (ms) a (ms) (ms) b (ms/bit) (ms/bit) (bits/s)b------------------------------------------------------------------------------ **** Pointing **** 5 .9501 64 230 21 166 6.2 6.0 6 .9637 54 177 19 169 6.5 5.9 **** Dragging **** 7 .9921 38 135 36 198 13.0 5.1 8 .9711 54 345 36 198 13.0 5.1 ============================================================================== a p < .001 b IP = 1/b
Since the correlations were very high (r > .9000, p <.001), it is not surprising that standard errors throughout were low. Itappears the regression equations were all highly representative of observationsin the respective tasks. More relevant, however, is whether or not the twopointing equations are "the same", and whether or not the two draggingequations are "the same". The standard error for each regression coefficientis valuable for this comparison. First, examining the two pointing equationswith Equation 7 as the reference, the slope coefficients only differ by (169- 166) / 6.5 = 0.46 SEs. The intercept in Equation 5,however, is 2.8 SEs higher than the intercept in Equation 7. Thelatter difference would only occur 0.5% of the time through random effects(with the assumption of normality); so, despite the insignificant differencesin slopes, it cannot be assumed that the two prediction equations apply to thesame underlying task. This may be attributable to the subtle differences inthe tasks (point-select vs. point-drag-select).The two dragging equations in Table 2 are quite different. UsingEquation 8 as the reference, the slope is 3.9 SEs higher and theintercept 5.8 SEs lower for Equation 6. There are several possiblesources of this disparity. First, the models are from experiments conductedseparately using different subjects. Second, the range of conditions wasdifferent. IDs ranged from 1 to 6 bits in MacKenzie et al. (1991) andfrom 1.8 to 5 bits in the present experiment. Finally, the tasks weredifferent. Equation 8 was derived from a serial dragging task, but wasapplied to data for the dragging phase of a discrete point-drag-selecttask.
We expect even greater disparities if the derived models were applied toState 1 and State 2 actions in real applications on interactivegraphics systems, where an assortment of user actions arise. Tasks such asselecting words or blocks of text in a word processing environment, acquiringand manipulating icons, or selecting an item in a pull-down menu would severelytest the generality of a model built in a research environment. As engineeringtools, designers are cautioned not to rely on establish Fitts' law models toprovide accurate predictions unless the device and task conditions in the newinterface closely match those from the original research.
Since the present experiment included a balanced set of square,short-and-wide, and tall-and-narrow drag targets (see Table 1), Hand W were not correlated. This permitted a valid test of Gillan etal.'s (1990) model against the STATUS QUO and SMALLER-OF models. (TheW' model is the same as the STATUS QUO model, in this case, becausethe approach angle was consistently 0°.)Correlations for the STATUS QUO, SMALLER-OF, and target height modelsrespectively were .9711 (p < .001), .9688 (p < .001), and.6403 (p < .005). The poor showing of the target height model wasfully anticipated. Since target height is measured perpendicular to the lineof approach (in left-to-right dragging tasks), there is no reasonable basis forit to serve as target width in the model. Target height would have only aslight effect on movement time, since motion was one-dimensional along thehorizontal axis. Therefore, the top ranking for the STATUS QUO model(which is the same as the W' model in this case) was not surprising.
This paper has demonstrated that the point-drag sequence common oninteractive systems with a graphical user interface can be modeled as twoseparate Fitts' law tasks -- a point-select task followed by a drag-selecttask. Prediction models with high correlations and low standard errors weredeveloped; however, when compared with models from previous research usingsimilar tasks, the predictions were not as close as the standard errorsimplied. Based on this, we conclude that caution must be exercised in takingmodels built in a research setting and applying them subsequently on realsystems: A model with a very high correlation may not stand-up to subsequentpredictions in different settings.
The present attempt to apply derived models to subsequent tasks illustratesthe difficulty in adopting models such as Fitts' law to practical problems ininterface design. Meeting the usual statistical tests for validity seems easyin comparison to the challenges in applying the model later. Expectations mustbe kept low. A statistically sound model will be accompanied by a smallstandard error of estimate; but confidence intervals will not be met laterunless the model was derived under conditions very similar to the application.
A problem in applying Fitts' law in two dimensional tasks is in choosing anappropriate "target width" to substitute as "W" in the calculation oftask difficulty. The claim of Gillan et al. (1990) that target height is theappropriate substitute for target width in dragging tasks was not supported.The experiment described herein varied the dragging target's width and heightindependently. Both the STATUS QUO model and the SMALLER-OF modeloutperformed the target height model. We conclude that the appropriatesubstitute for target width in two-dimensional pointing or dragging tasks iseither the smaller of the target's width or height (SMALLER-OF model), or thewidth of the target along the angle of approach (W' model).
This research was supported by the Natural Sciences and EngineeringResearch Council of Canada, Xerox Palo Alto Research Center, Digital EquipmentCorp., and Apple Computer Inc. We gratefully acknowledge this contribution,without which, this work would not have been possible.
Boritz, J., Booth, K. S., & Cowan, W. B. (1991). Fitts's law studies ofdirectional mouse movement. Proceedings of Graphics Interface '91,216-223. Toronto, Ontario: Canadian Information Processing Society.
Buxton, W. (1990). A three-state model of graphical input. In D. Diaper etal. (Eds.), Human-Computer Interaction -- INTERACT '90, 449-456.Amsterdam: Elsevier.
Card, S. K., Moran, T. P., & Newell, A. (1983). The psychology ofhuman-computer interaction. Hillsdale, NJ: Erlbaum.
Fitts, P. M. (1954). The information capacity of the human motor system incontrolling the amplitude of movement. Journal of ExperimentalPsychology, 47, 381-391.
Fitts, P. M., & Peterson, J. R. (1964). Information capacity ofdiscrete motor responses. Journal of Experimental Psychology, 67,103-112.
Gillan, D. J., Holden, K., Adam, S., Rudisill, M., & Magee, L. (1990).How does Fitts' law fit pointing and dragging? Proceedings of the CHI '90Conference on Human Factors in Computing Systems, 227-234. New York:ACM.
Gillan, D. J., Holden, K., Adam, S., Rudisill, M., & Magee, L. (1992).How should Fitts' law be applied to human-computer interaction. Interactingwith Computers, 4, 291-313.
MacKenzie, I. S. (1989). A note on the information-theoretic basis forFitts' law. Journal of Motor Behavior, 21, 323-330.
MacKenzie, I. S. (1992). Fitts' law as a research and design tool inhuman-computer interaction. Human-Computer Interaction, 7,91-139.
MacKenzie, I. S., & Buxton, W. (1992). Extending Fitts' law totwo-dimensional tasks. Proceedings of the CHI '92 Conference on HumanFactors in Computing Systems, 219-226. New York: ACM.
MacKenzie, I. S., Sellen, A., & Buxton, W. (1992). A comparison ofinput devices in elemental pointing and dragging tasks. Proceedings of theCHI '91 Conference on Human Factors and Computing Systems, 161-166. NewYork: ACM.
Meyer, D. E., Smith, J. E. K., Kornblum, S., Abrams, R. A., & Wright,C. E. (1990). Speed-accuracy operating tradeoffs in aimed movements: Toward atheory of rapid voluntary action. In M. Jeannerod (Ed.), Attention andperformance XIII (pp. 173-226). Hillsdale, NJ: Erlbaum.
Welford, A. T. (1968). Fundamentals of skill. London:Methuen.


